


IELTS
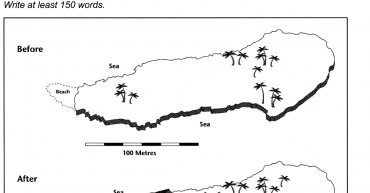
Cambridge IELTS 9, Test 1, Writing Task 1, Map, Band 7 You should spend 20 minutes on this task. The two maps below show an island, before and after the construction ofsome tourist facilities. Summarize the information by selecting and reportingthe main features, and make comparisons where relevant.Summarize the information by selecting and reporting the […]
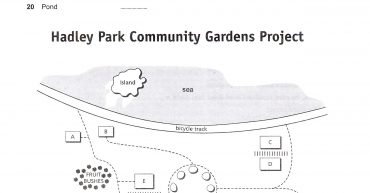
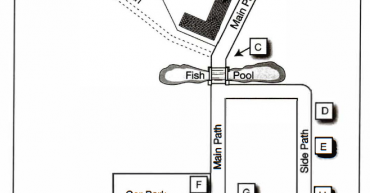
The official Cambridge guide to IELTS, Test 4, Listening Section 2 Map Questions Audio File Audio Script Hadley Park Community Gardens Project Manager : Good morning. It’s great to see so many people here. Thank you all very much for coming. Well, as you know, the community gardens that Hadley Park are really not looking […]
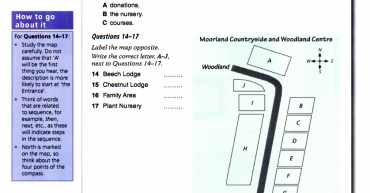
Ready for IELTS, Second Edition, Unit 6, Listening, Section 2 Map Questions British Accent Audio File Script 1 Good morning and welcome to theMoorland Countryside and WoodlandProgramme. I’d like to give you someinformation about the programme andthe short courses we run for people onwoodland awareness.We’re actually a programme run byvolunteers, and we were set up […]
Certificate of completion TTP002814 THIS IS PRESENTED TO ALI TAVAKOLI for completing the IELTS Teacher Training Program in September 2021. DIRECTOR, IELTS OPERATIONS AUSTRALASIA The IELTS Teacher Training Program is endorsed by English Australia’s Continuing Professional Development (CPD) Framework for 40 CPD points. English Australia’ s CPD is a professional development tool for ELI COS […]
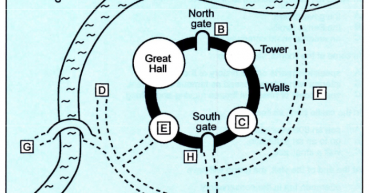
IELTS 11, Test 1, Section 2 Map Questions Listening Audio file at: https://sndup.net/4p34 Amswer Key: 11 animal / animals 12 tool / tools 13 shoes 14 dog / dogs 15 F 16 G 17 D 18 H 19 C 20 A
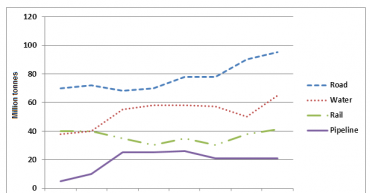
WRITING TASK 1 You should spend about 20 minutes on this task. The graph below shows the quantities of goods transported in the UK between 1974 and 2002 by four different modes of transport. Summarise the information by selecting and reporting the main features and make comparisons where relevant. Write at least 150 words. The […]
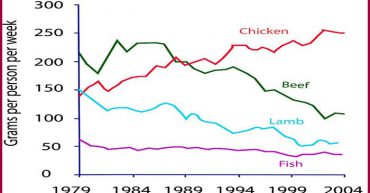
WRITING TASK 1 You should spend about 20 minutes on this task. The graph below shows the consumption of fish and different kinds of meat in a European country between 1979 and 2004. Summarise the information by selecting and reporting the main features and make comparisons where relevant. Write at least 150 words. The model […]